608.7 hectares changed — water gone
Pamba · 9.479, 76.388
Before: 19 May 2026 – 18 Jul 2026 · After: 2 Aug 2026 – 16 Sep 2026
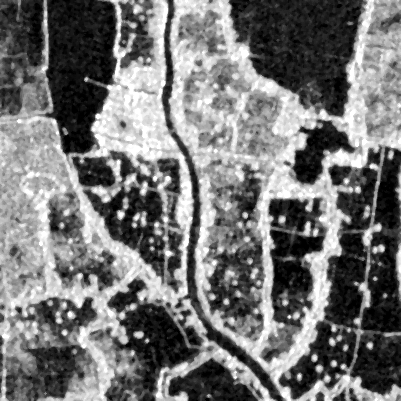
BEFORE 2026-07
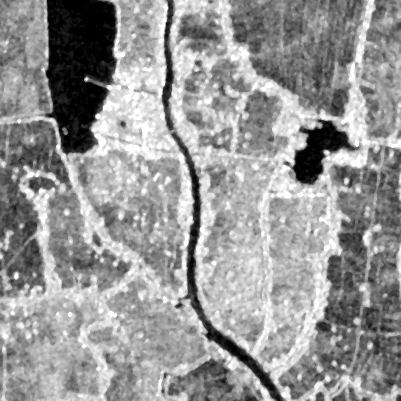
AFTER 2026-09
Drag to compare
608.7 haarea changed
38areas flagged
1,608 haarea examined
2satellites used
What SCOPE found
Water disappeared — 83.2 ha1.9 km north-east · 84% sure
Water disappeared — 58.6 ha1.5 km south · 86% sure
Water disappeared — 54.7 ha1.1 km south-east · 86% sure
Water disappeared — 53.8 ha1.8 km east · 83% sure
New water / flooding — 52.4 ha1.8 km west · 86% sure
…and 33 more area(s) in the full report.
How sure is this?
The strongest area (#1) has 84% confidence. It appears in 4 of 4 later clear images, so it is not a one-day artefact. Radar could not confirm or rule them out (normal for vegetation changes), so the result rests on repeated clear optical views and the seasonal comparison. Only 0% of the area had clear optical views, so some change may be hidden by cloud. Note: Optical imagery was unusable (cloud); results rely on Sentinel-1 radar only. Confidence measures how strong the evidence for real surface change is; it does not identify the cause or who did it.
How it was measured
SCOPE used Sentinel-2 optical imagery at 10 m, cloud-masked and combined over each period; Sentinel-1 radar, which sees through cloud, as an independent check; the same season in 2025, 2024, 2023, so normal seasonal change is not reported as real change. The whole analysis took 126 seconds.
What changed at your place?
Type any location on Earth. SCOPE compares satellite imagery from two periods and
explains what changed, roughly when, and how confident it is.
5 scans a month, free. No card.