Kochi metropolitan fringe
Wetland and paddy giving way to building on the edge of Kochi.
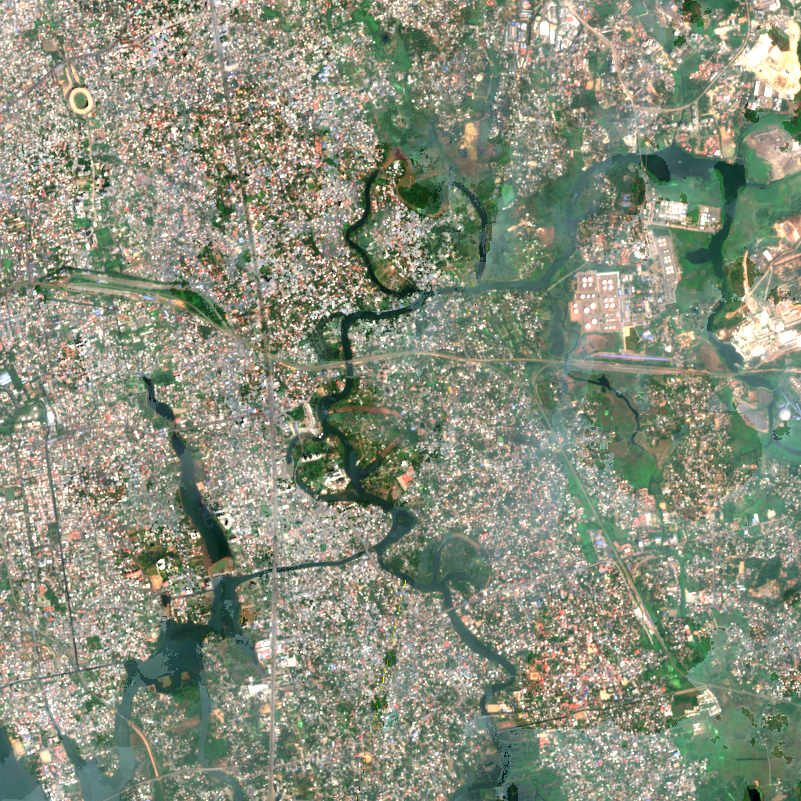
216.0 hectares changed — vegetation cleared · Before: 1 Dec 2018 – 15 Mar 2019 · After: 1 Dec 2024 – 15 Mar 2025 · 9.970, 76.330
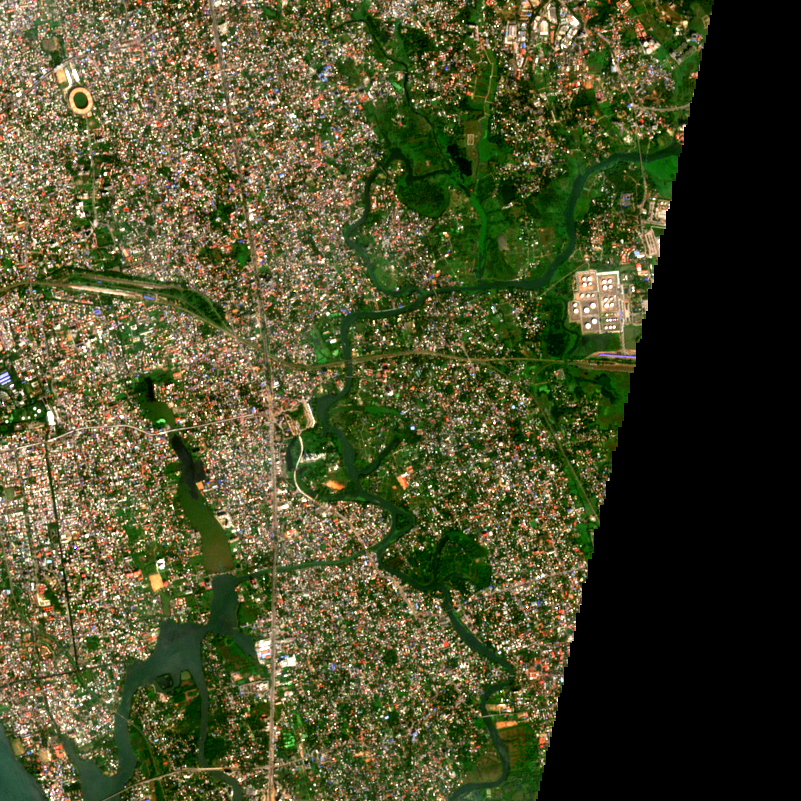
BEFORE 2019-03
AFTER 2025-03
Drag to compare
216.0 haarea changed
140areas flagged
6,416 haarea examined
2satellites used
What changed, by type
161.0 haVegetation cleared
27.3 haNew water / flooding
12.3 haNew construction / earthworks
12.0 haBurnt ground
2.8 haunclassified
0.6 haNew vegetation
Land changes in both directions at once. SCOPE reports every type it measured, not only the one that makes the better headline.
What SCOPE found
Vegetation cleared — 14.6 ha
2.5 km west · between 18 Dec 2018 and 25 Jan 2025 · 89% sure
2.5 km west · between 18 Dec 2018 and 25 Jan 2025 · 89% sure
Vegetation cleared — 11.0 ha
4.2 km north-east · between 18 Dec 2018 and 6 Feb 2025 · 87% sure
4.2 km north-east · between 18 Dec 2018 and 6 Feb 2025 · 87% sure
Burnt ground — 10.0 ha
1.1 km south-west · between 18 Dec 2018 and 25 Jan 2025 · 93% sure
1.1 km south-west · between 18 Dec 2018 and 25 Jan 2025 · 93% sure
Vegetation cleared — 7.3 ha
2.2 km north-west · between 18 Dec 2018 and 25 Jan 2025 · 94% sure
2.2 km north-west · between 18 Dec 2018 and 25 Jan 2025 · 94% sure
Vegetation cleared — 5.2 ha
3.7 km west · between 18 Dec 2018 and 25 Jan 2025 · 92% sure
3.7 km west · between 18 Dec 2018 and 25 Jan 2025 · 92% sure
How sure is this?
The strongest area (#1) has 89% confidence. It appears in 5 of 6 later clear images, so it is not a one-day artefact. Radar confirmed some of these areas; the others rest on optical and seasonal evidence. Compared with the same season in earlier years, this is clearly unusual. Only 78% of the area had clear optical views, so some change may be hidden by cloud. Note: One optical window has a single clear acquisition; persistence checks are weaker. Confidence measures how strong the evidence for real surface change is; it does not identify the cause or who did it.
How it was measured
SCOPE used Sentinel-2 optical imagery at 10 m, cloud-masked and combined over each
period, Sentinel-1 radar as an independent check
, and the same season in earlier years so normal seasonal change is not reported as real change.
The analysis took 26 seconds.
Now try it on a place you know
If SCOPE is right about somewhere you know well, you can trust it somewhere you do not. 5 scans a day, free, no card.
Scan your own place