Gansu wind corridor
Turbine foundations and access tracks spreading across the Gobi.
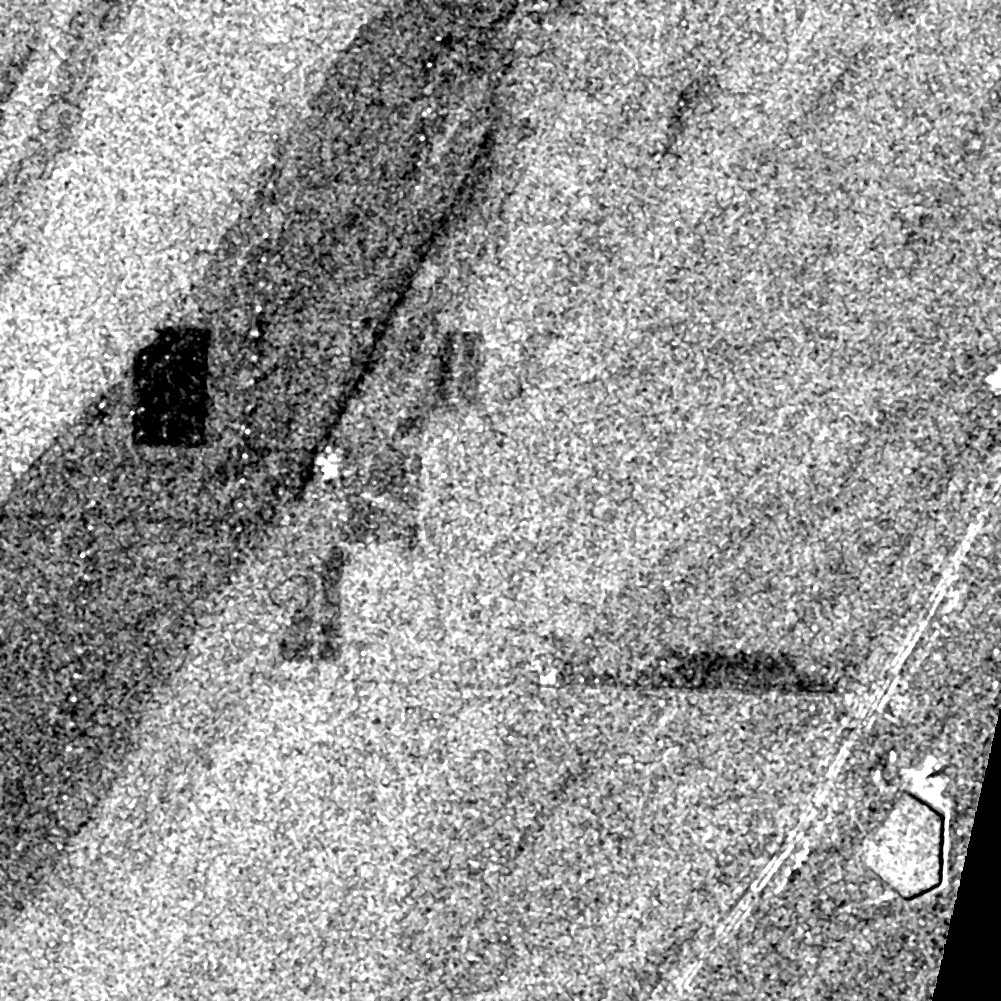
113.3 hectares changed — new water / flooding · Before: 1 Apr 2017 – 31 Jul 2017 · After: 1 Apr 2023 – 31 Jul 2023 · 40.200, 96.900
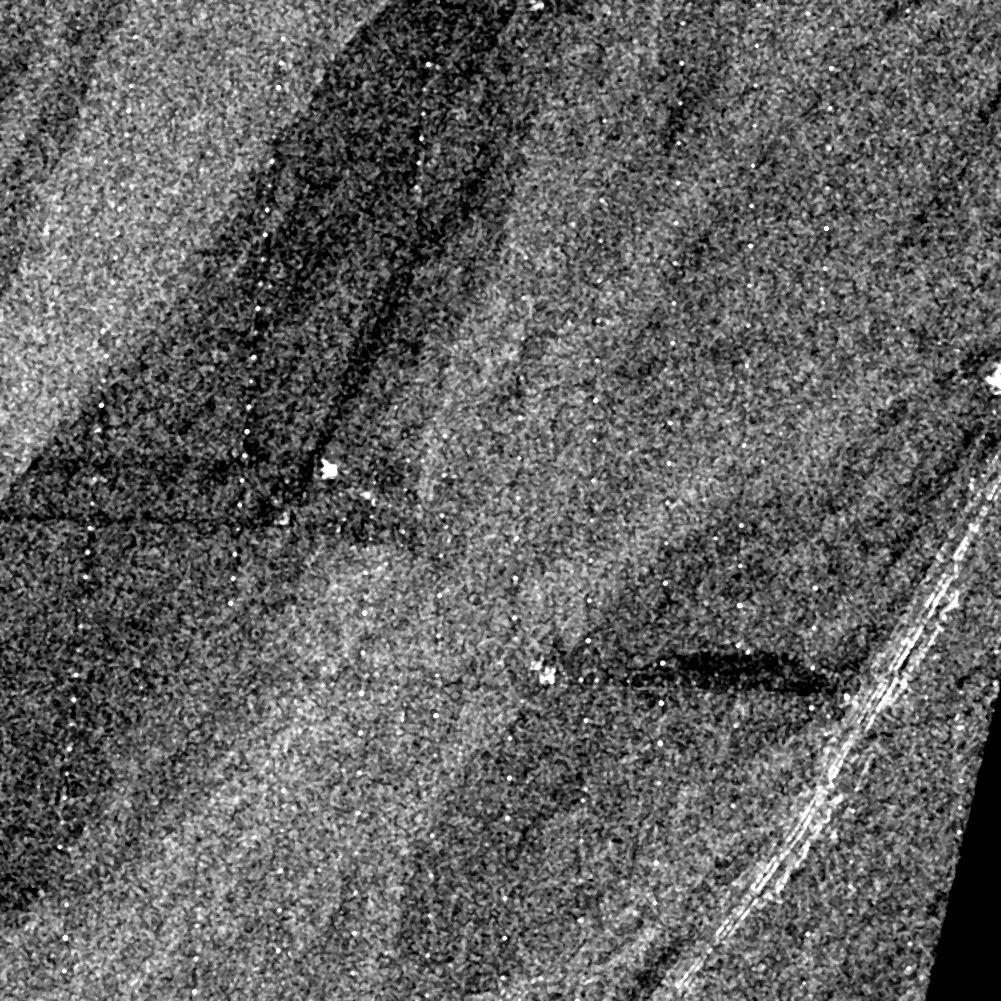
BEFORE 2017-07
AFTER 2023-07
Drag to compare
113.3 haarea changed
10areas flagged
10,020 haarea examined
2satellites used
What changed, by type
66.0 haNew water / flooding
22.5 haNew construction / earthworks
18.5 haWater disappeared
6.2 haunclassified
Land changes in both directions at once. SCOPE reports every type it measured, not only the one that makes the better headline.
What SCOPE found
New water / flooding — 57.9 ha
3.5 km west · 80% sure
3.5 km west · 80% sure
New construction / earthworks — 11.9 ha
5.2 km south-east · 77% sure
5.2 km south-east · 77% sure
Water disappeared — 18.5 ha
5.8 km south-east · 62% sure
5.8 km south-east · 62% sure
New construction / earthworks — 6.4 ha
5.3 km south-east · 72% sure
5.3 km south-east · 72% sure
Unclassified surface change — 6.2 ha
5.7 km south-east · 64% sure
5.7 km south-east · 64% sure
How sure is this?
The strongest area (#1) has 80% confidence. It appears in 6 of 6 later clear images, so it is not a one-day artefact. Radar could not confirm or rule them out (normal for vegetation changes), so the result rests on repeated clear optical views and the seasonal comparison. Only 0% of the area had clear optical views, so some change may be hidden by cloud. Note: Optical imagery was unusable (cloud); results rely on Sentinel-1 radar only. Confidence measures how strong the evidence for real surface change is; it does not identify the cause or who did it.
How it was measured
SCOPE used Sentinel-2 optical imagery at 10 m, cloud-masked and combined over each
period, Sentinel-1 radar as an independent check
.
The analysis took 15 seconds.
Now try it on a place you know
If SCOPE is right about somewhere you know well, you can trust it somewhere you do not. 5 scans a day, free, no card.
Scan your own place